
Performance
Scanfully times a request to your site every 15 minutes and splits it into five phases. The Performance screen shows those timings for the period you pick, the details of the latest check, and the PHP and cache setup behind them.
To open it, choose a site and click Performance under Monitoring in the site menu.
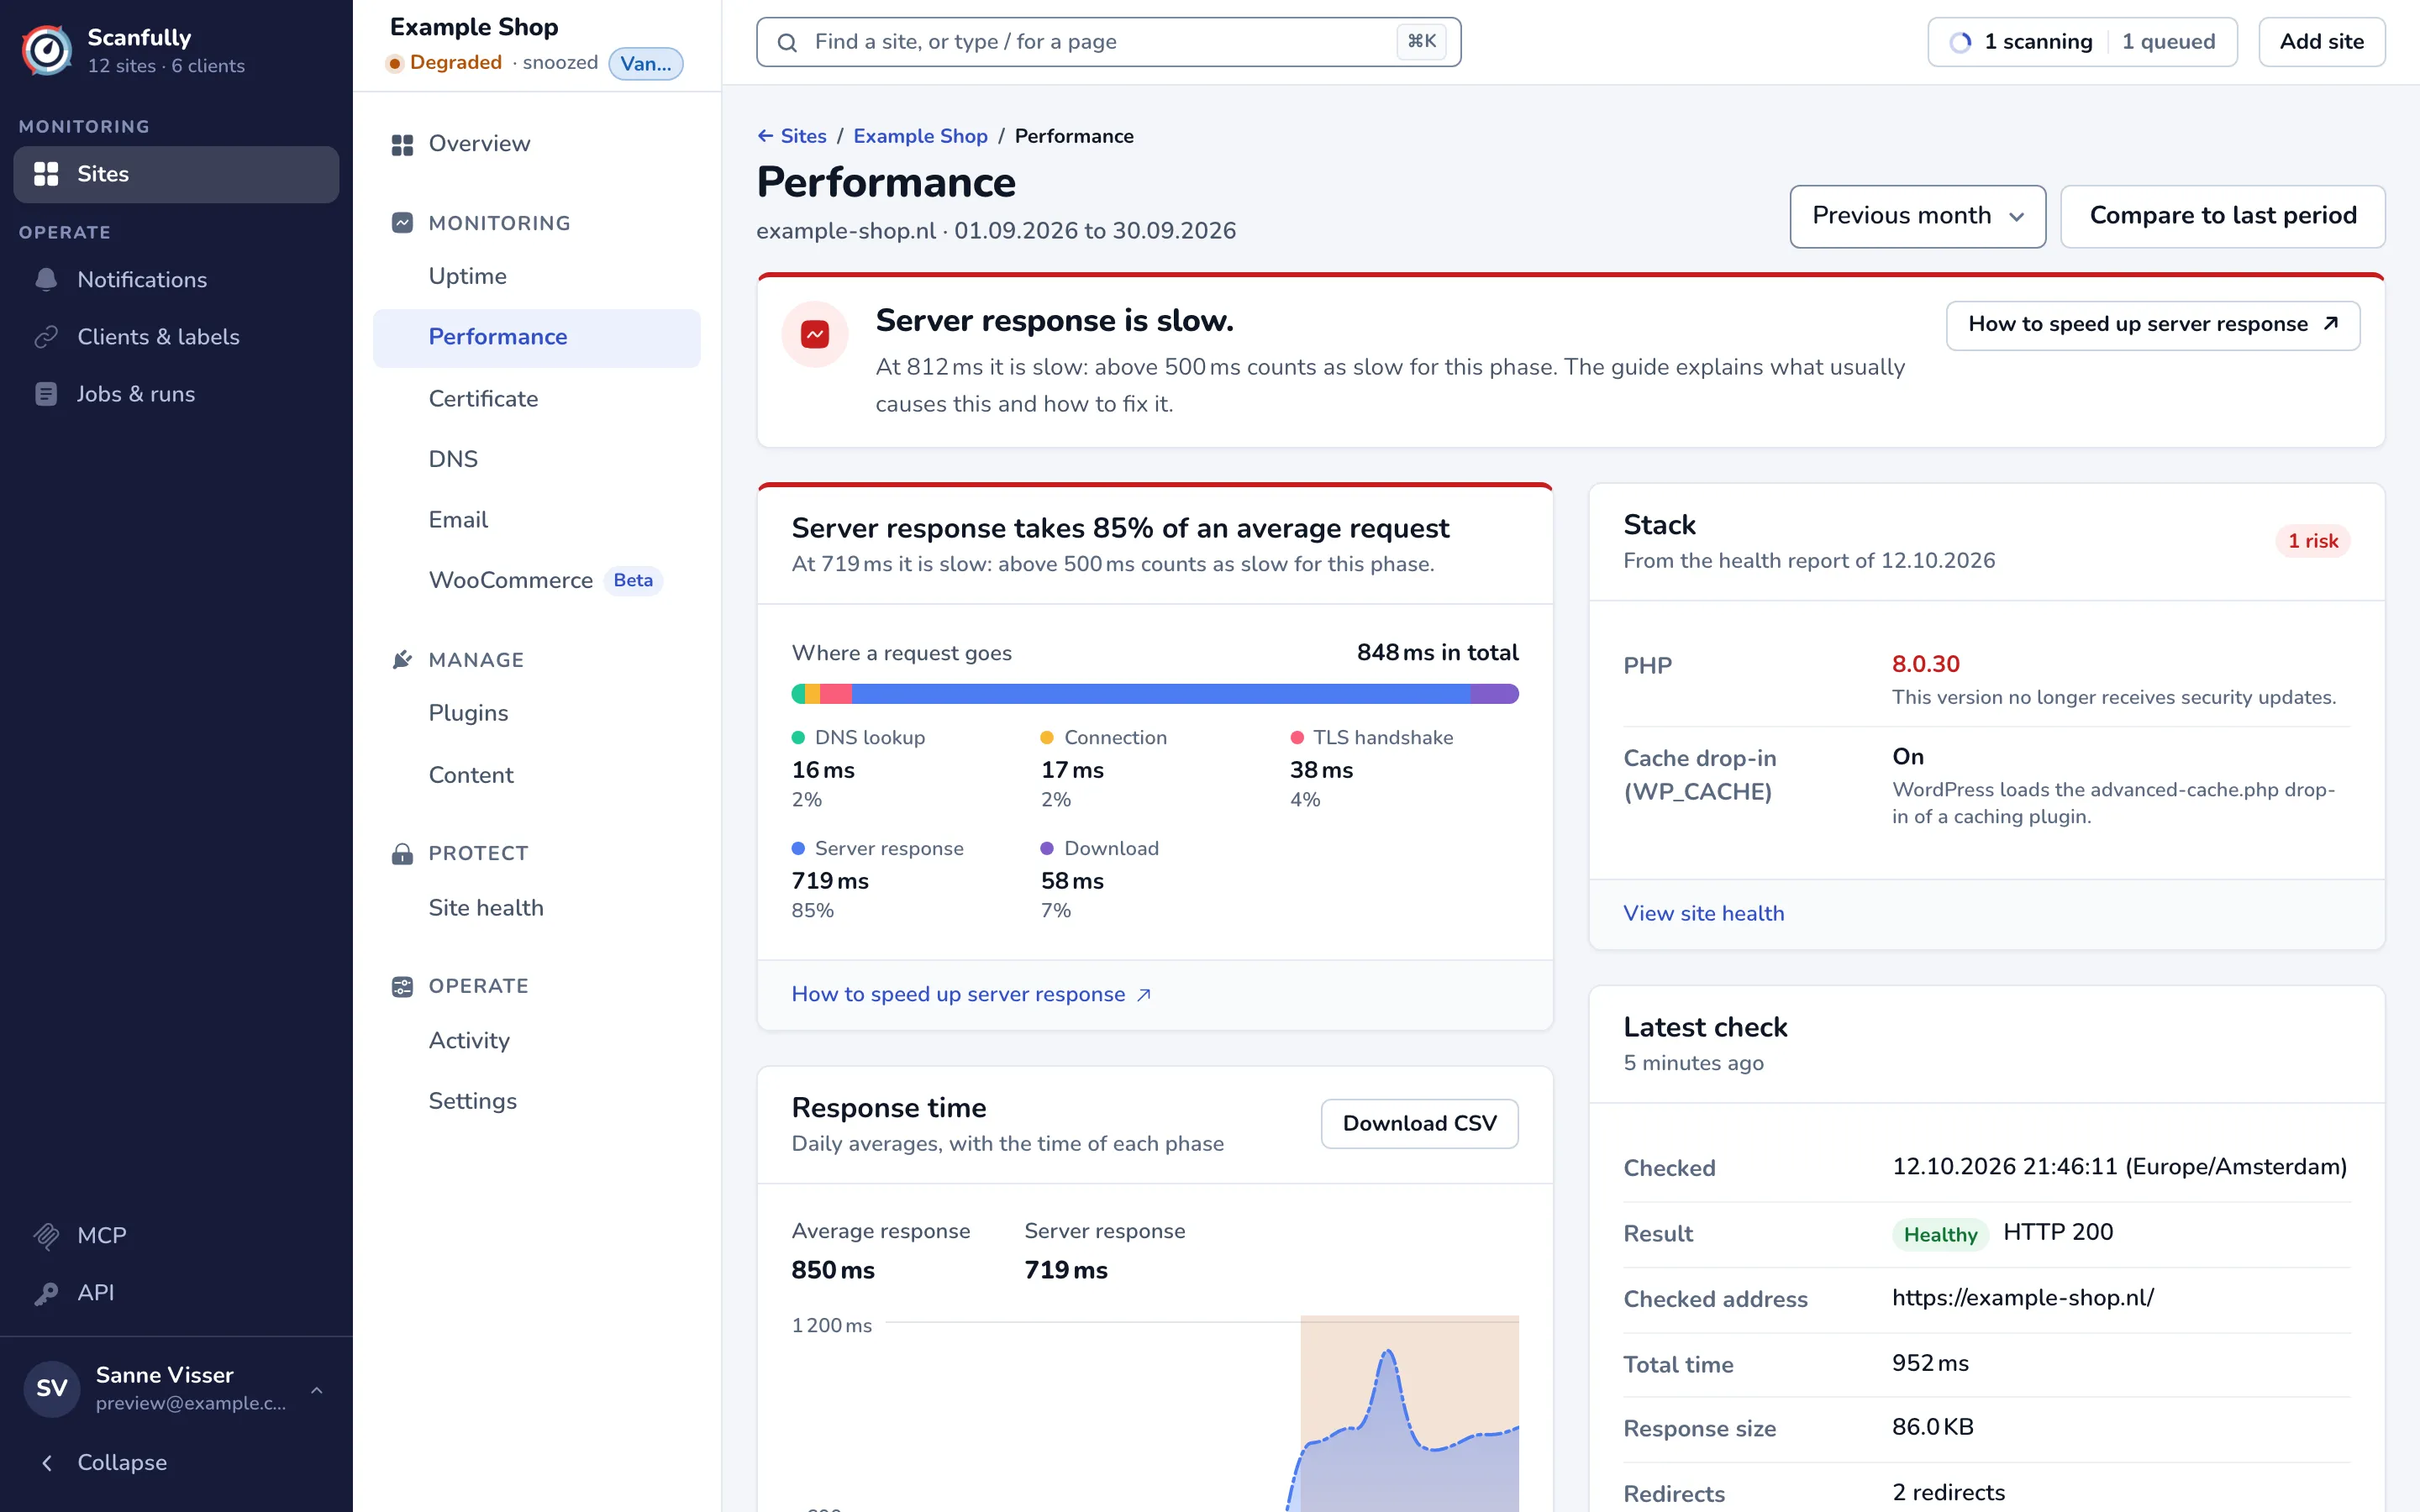
The phases of a request
Section titled “The phases of a request”Every check measures the same five phases, in the order they happen:
| Phase | What it measures | Fast up to | Slow above |
|---|---|---|---|
| DNS lookup | Looking up the IP address of your site. | 50 ms | 200 ms |
| Connection | Opening a TCP connection to your server. | 100 ms | 300 ms |
| TLS handshake | Exchanging and checking the TLS certificate of your site. | 300 ms | 500 ms |
| Server response | Your server handling the request and sending the first byte back (time to first byte, TTFB). | 300 ms | 500 ms |
| Download | Downloading the HTML of the page. | 1000 ms | 4000 ms |
A phase between the two limits counts as acceptable, but not fast. Each phase has a guide on what usually slows it down and how to fix it:
- How to improve DNS lookup time
- How to optimize TCP connection performance
- How to improve TLS/SSL handshake time
- How to solve slow Time to First Byte (TTFB) and Debug TTFB peaks
- How to improve your download content time
Pick a period
Section titled “Pick a period”Use the menu at the top right to choose Last 24 hours, Last 7 days, Last 30 days, Previous month or This year. The subtitle under the title shows the dates the period covers. The chart plots every check for the last 24 hours, hourly averages for the last 7 days, and daily averages for the longer periods.
When a period has no checks, the screen says so; Show the last 30 days switches to a longer period.
The headline
Section titled “The headline”The panel at the top judges the latest check by its slowest phase. It names a slow phase (for example Server response is slow.), a phase that is acceptable but not fast, or says The site responds fast. when every phase is within its fast limit. The button on the right opens the guide for that phase.
Where a request goes
Section titled “Where a request goes”This panel splits the average request of the period into the five phases, as a bar with the time and share of each phase and the total. When one phase takes half of the time or more, the panel title says so, for example Server response takes 85% of an average request, with a link to its guide.
Response time
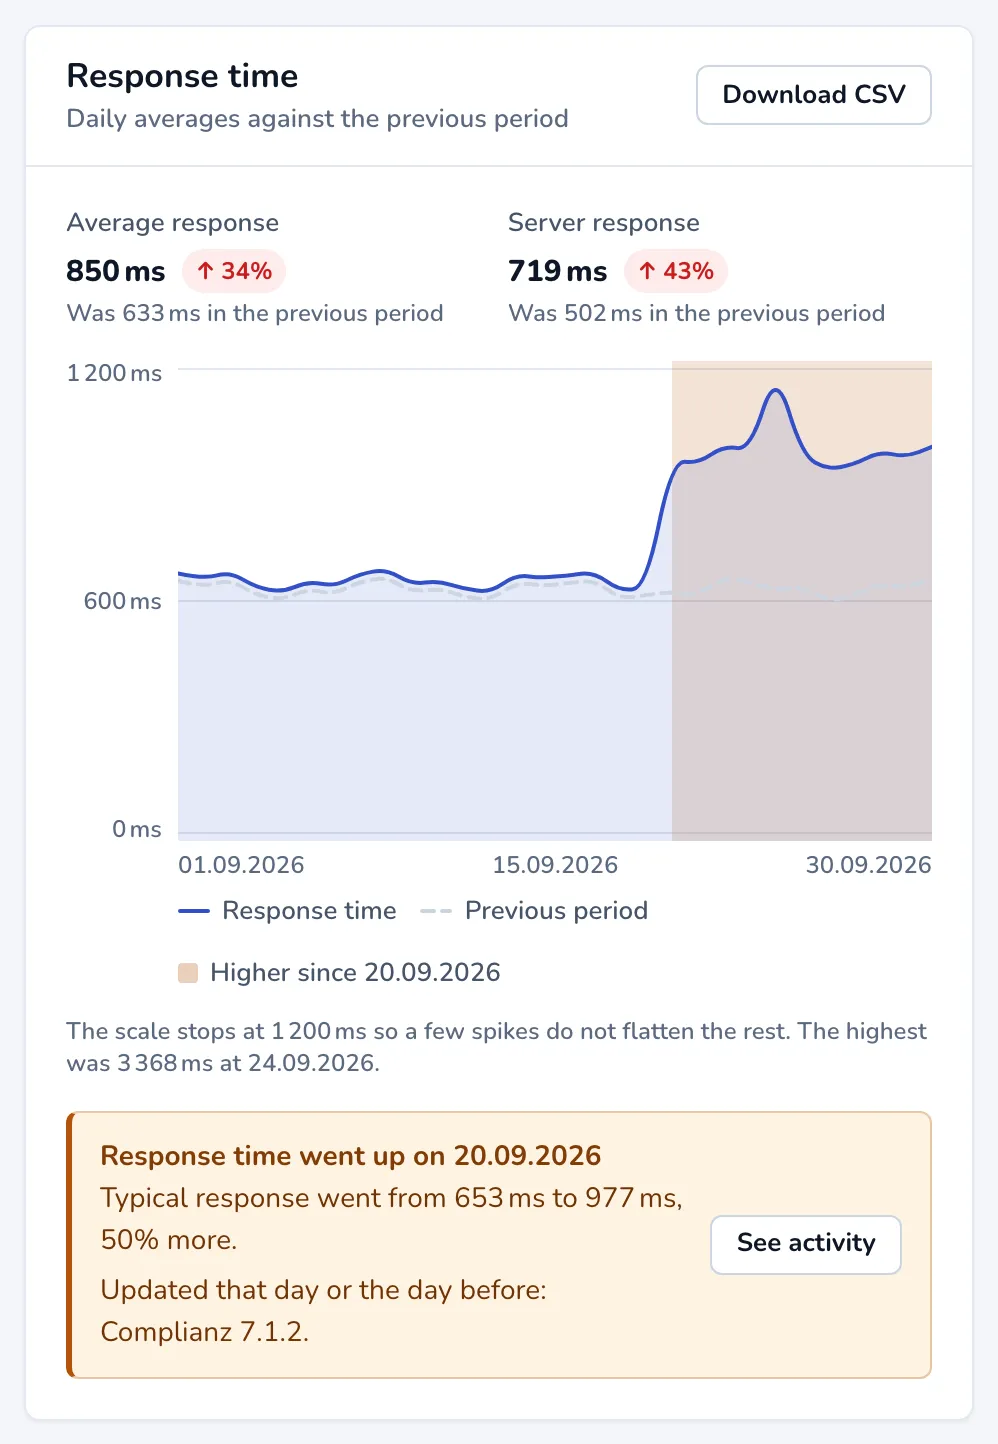
Section titled “Response time”The chart shows the time of each phase over the period, with Average response and Server response for the whole period above it.
- When a few spikes would flatten the rest, the scale stops below them and a line under the chart names the highest one.
- When the response time stepped up and stayed up, a shaded band marks it (Higher since a date) and a note under the chart says by how much. If the activity log recorded plugin, theme or WordPress updates just before, the note lists them. See activity opens the activity log.
- Download CSV saves the points of the period, with the time of each phase and the response time in milliseconds (times in UTC).
Compare with the period before
Section titled “Compare with the period before”Click Compare to last period to draw the response time of the period against the one before it, for example September against August. The figures above the chart then show the change in percent and the earlier value. Click Hide last period to go back to the phases.
Stack shows the PHP version and whether the WordPress cache drop-in (WP_CACHE) is on, from the latest site health report the Scanfully plugin sent. A PHP version that no longer gets security updates, or whose active support has ended, shows as a risk. A cache run by your host does not show here, so Off is not a problem by itself. View site health opens Site health. See also What does the WP_CACHE constant do?.
Latest check
Section titled “Latest check”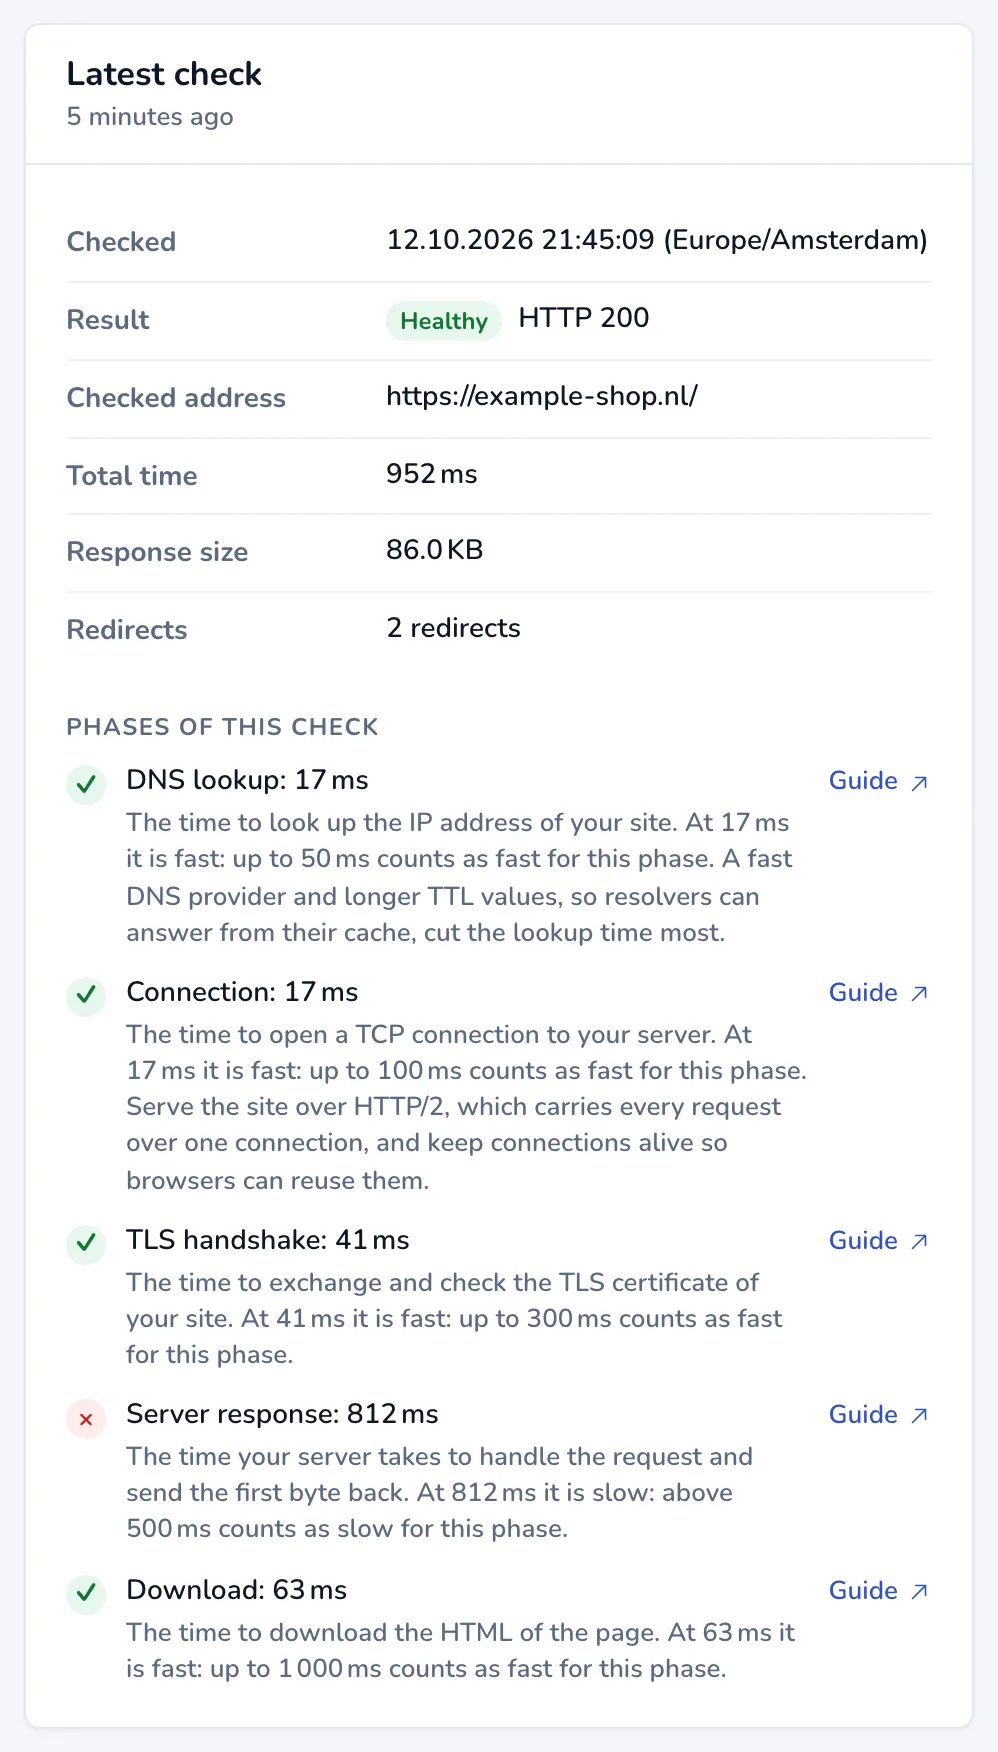
Latest check shows the most recent check: when it ran, the result and HTTP status, the Checked address, the Total time, the Response size and the number of Redirects. Under Phases of this check, each phase has its time, what it measures, whether it is fast, acceptable or slow, and a Guide link.
Redirect chain
Section titled “Redirect chain”When the latest check followed redirects before the page answered, Redirect chain lists every step with where it came from, where it went, its status code and how long it took. Each redirect adds time to every visit, so point links and the site address straight at the final URL where you can.