
Sites
Sites is the first screen you see after signing in. It lists every site in your account, shows at a glance which ones need you, and takes you into a site with one click. Open it from Sites under Monitoring in the main menu.
The header
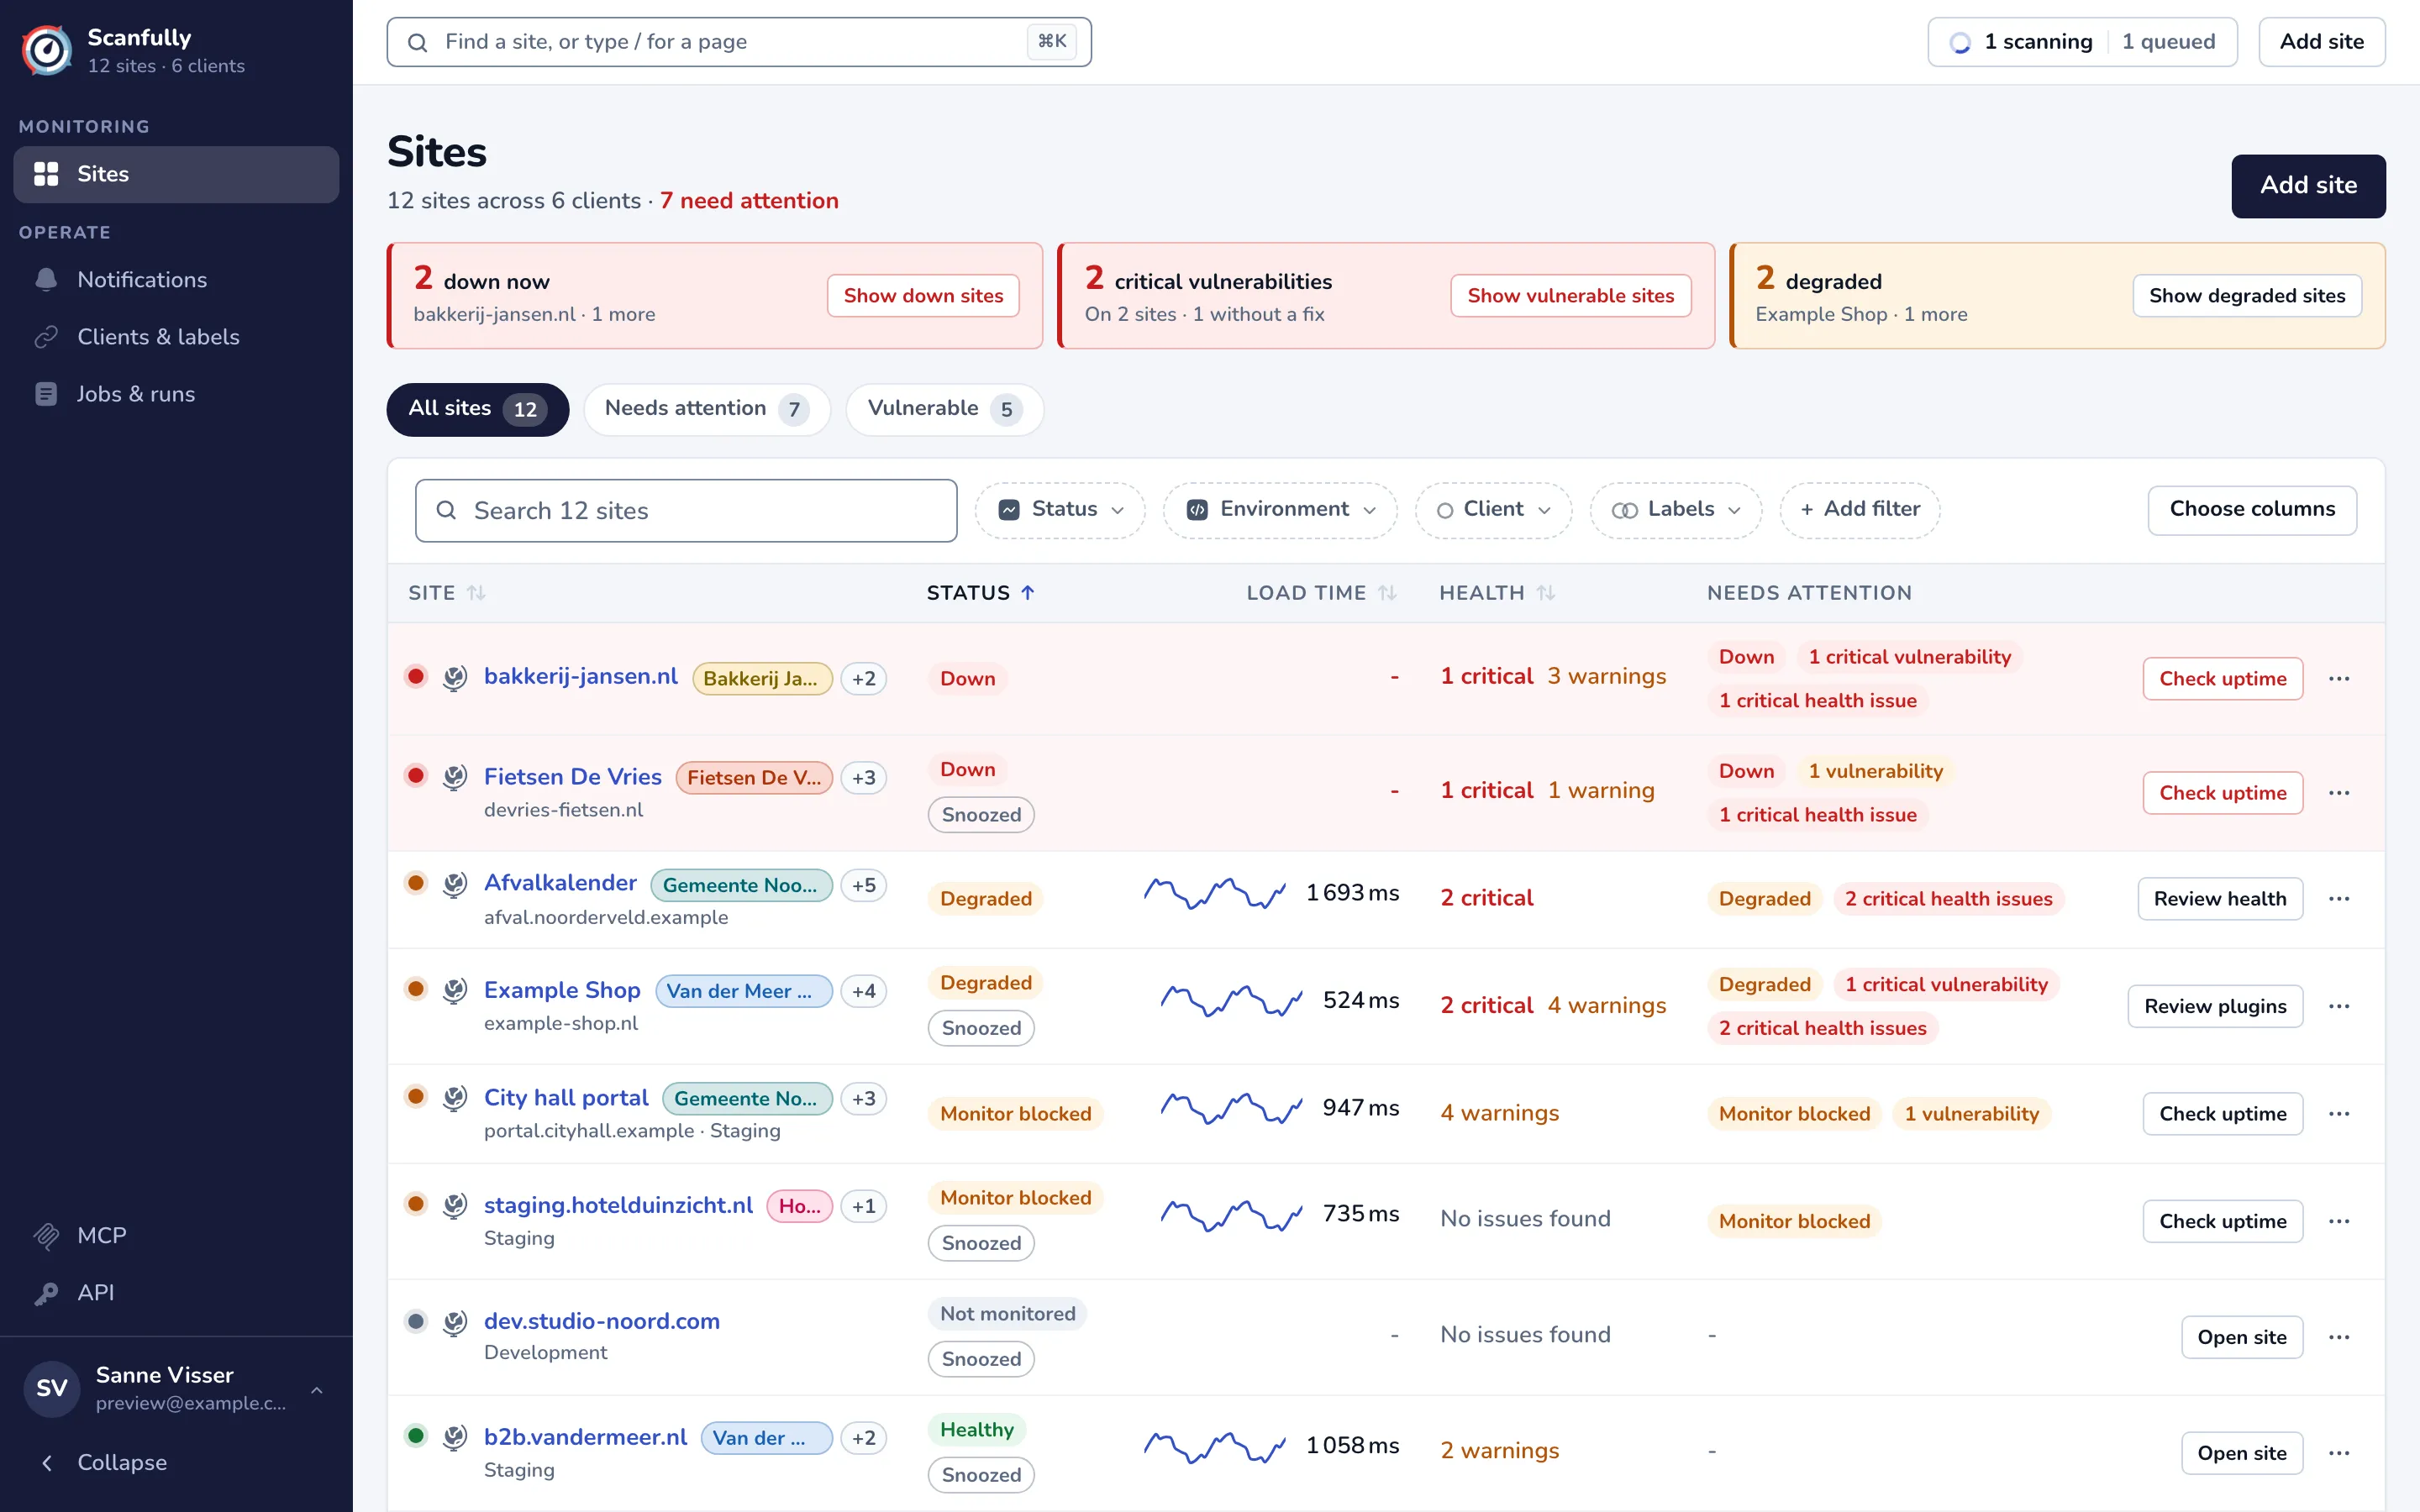
Section titled “The header”Under the Sites title, a line counts your sites, the clients they belong to (when you use clients) and how many sites need attention, for example “12 sites across 6 clients · 7 need attention”.
Use Add site at the top right to add another site. See Add a site.
Alert tiles
Section titled “Alert tiles”When something is wrong, tiles above the list show the figures to act on first. A tile only shows when it counts something:
- down now: the sites that are down, with Show down sites (or Check uptime when it is one site).
- critical vulnerabilities: the critical plugin vulnerabilities across your sites, whether a fix is available, and Show vulnerable sites (or Review plugins for one site).
- degraded: the sites that respond intermittently or with errors, with Show degraded sites (or Check uptime for one site).
The tabs above the table switch between views. Each tab shows how many sites it holds.
- All sites: every site.
- Needs attention: sites that are down, degraded or have their monitor blocked, or that have a known vulnerability or a critical health issue.
- Vulnerable: sites with at least one plugin that has a known vulnerability.
Your saved filters appear as extra tabs after these.
The table
Section titled “The table”Each row is one site. Click a row, or the site’s name, to open its overview.
| Column | What it shows |
|---|---|
| Site | The site’s label (or its domain), its client and labels as colored pills, and below that the domain and the WordPress environment when it is not production. The dot in front shows the status. |
| Status | Healthy, Degraded, Down, Monitor blocked or Not monitored. Hover the pill for what it means. Snoozed shows when alerts for the site are snoozed. |
| Load time | The latest hourly average of the total load time, with a small chart of the last 48 hours. It stays empty while the site is down. |
| Health | The number of critical issues and warnings in the site’s health report, or No issues found. Click it to open Site health. |
| Needs attention | Pills for what needs you: down, degraded, monitor blocked, vulnerabilities and critical health issues. |
Monitor blocked means the site’s server or firewall refused the Scanfully uptime monitor on the latest check. Visitors can probably still reach the site, but you need to let the monitor through. See Scanfully IP addresses.
Health, version and disk figures come from the Scanfully WordPress plugin. A site added without the plugin shows no values there.
Row actions
Section titled “Row actions”At the end of each row is a button for the most useful next step: Check uptime for a site that is down, degraded or blocked, Review plugins for a vulnerable site, Review health for a site with critical health issues, or Open site when nothing is wrong.
The … menu next to it opens the site’s Overview, Uptime, Performance, Site health, Plugins or Settings. It also has Snooze alerts… to pause alerts for the site, and Change snooze… and Resume alerts while a snooze runs. See Notifications.
Sorting and pages
Section titled “Sorting and pages”Click a column heading to sort on it, and click again to reverse the order. The first click puts the worst sites first: the most urgent status, the slowest load time, the most health issues.
The footer counts the sites in the view and their critical vulnerabilities. With more than 20 sites you can show 20, 50 or 100 per page.
Search
Section titled “Search”Type in Search sites above the table to narrow the list to sites whose name, domain or client contains your text.
Filter the list
Section titled “Filter the list”The filter bar has a menu for each filter. Each option shows how many sites have it, and you can pick several options in one menu: a site then matches when it has any of them.
- Status: Down, Degraded, Monitor blocked, Healthy or Not monitored.
- Environment: the WordPress environment type the plugin reports (Production, Staging, Development, Local). It only shows when a site reports one.
- Client: one or more clients, or No client. It shows once you have clients.
- Labels: one or more labels, or No labels. You can match sites that have any of the chosen labels or all of them. It shows once you have labels.
Add filter adds more filters to the bar:
- WordPress version and PHP version: by release branch, so 6.8 matches 6.8.3.
- Search engines: whether WordPress asks search engines not to index the site (Discouraged) or not (Allowed).
- Debug mode: On, errors shown on screen, On, errors hidden or Off.
- Multisite: Multisite network or Single site.

The menu only offers filters that at least one of your sites reports a value for. An added filter opens right away; use its × to take it off the bar again.
Clear filters removes the search and every filter at once.
The filters are part of the page address, so you can bookmark or share a filtered list. The Show sites buttons on Clients & labels open the list filtered this way.
Save a filter
Section titled “Save a filter”To keep a combination of filters and search as a view of its own:
- Set the filters and search you want while All sites is the active view.
- Click Save filter.
- Enter a name, such as “Shops down” or “Staging sites”, and click Save filter.
The saved filter appears as a tab beside All sites, with its own count. Click the tab to apply it again. To remove it, open the tab and click Delete saved filter. That only removes the tab: the filters stay applied until you change them.
Saved filters are kept in your browser, so they don’t follow you to another browser or computer.
Choose columns
Section titled “Choose columns”Choose columns at the right of the filter bar turns columns on and off. Status, Load time, Health and Needs attention show by default. You can also add:
- WordPress and PHP: the version the site runs, with a note such as Update available, Security update, Support ended or End of life when the health report flags it.
- Disk usage: the size of the database and the wp-content folder.
- SSL certificate: how many days the certificate has left, Expired, or None found.
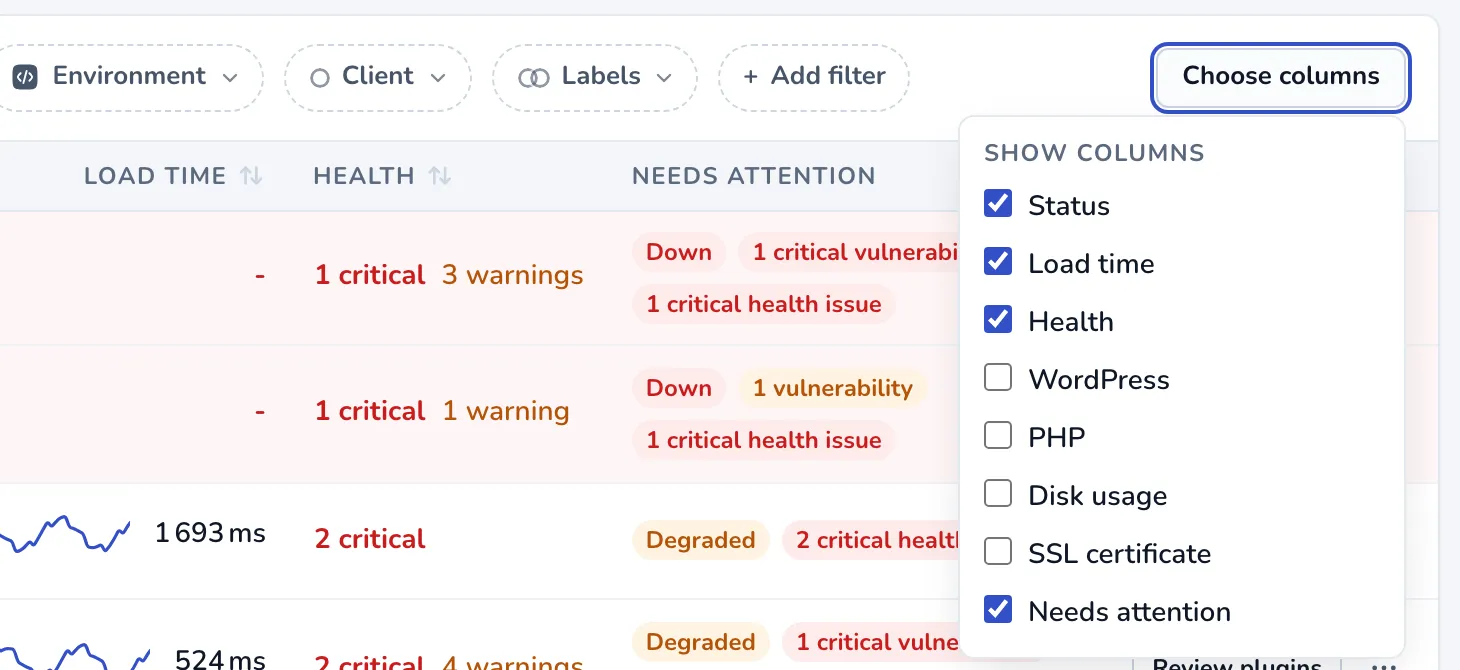
Your choice is kept in this browser. Each of these columns can be sorted too.
Find a site from anywhere
Section titled “Find a site from anywhere”The search field at the top of every screen, Find a site, or type / for a page, finds a site by its name or domain. Press ⌘K (Mac) or Ctrl K (Windows and Linux) to jump to it. Choosing a site opens the same screen for that site: from one site’s Uptime screen you go straight to the other site’s Uptime screen.
Type / followed by a page name or path, such as /jobs or /billing, to jump to an account-wide page instead.
When there are no sites
Section titled “When there are no sites”A new account shows No sites yet with Add a site. See Get started.