
Site overview
The Overview is the first screen of a site. It answers one question: does this site need you? Below that it summarizes uptime, recent activity, the environment the site runs on and its response time, each with a link to the screen that has the details.
Open it by clicking a site in the Sites list, or with Overview at the top of the site menu.
The site menu
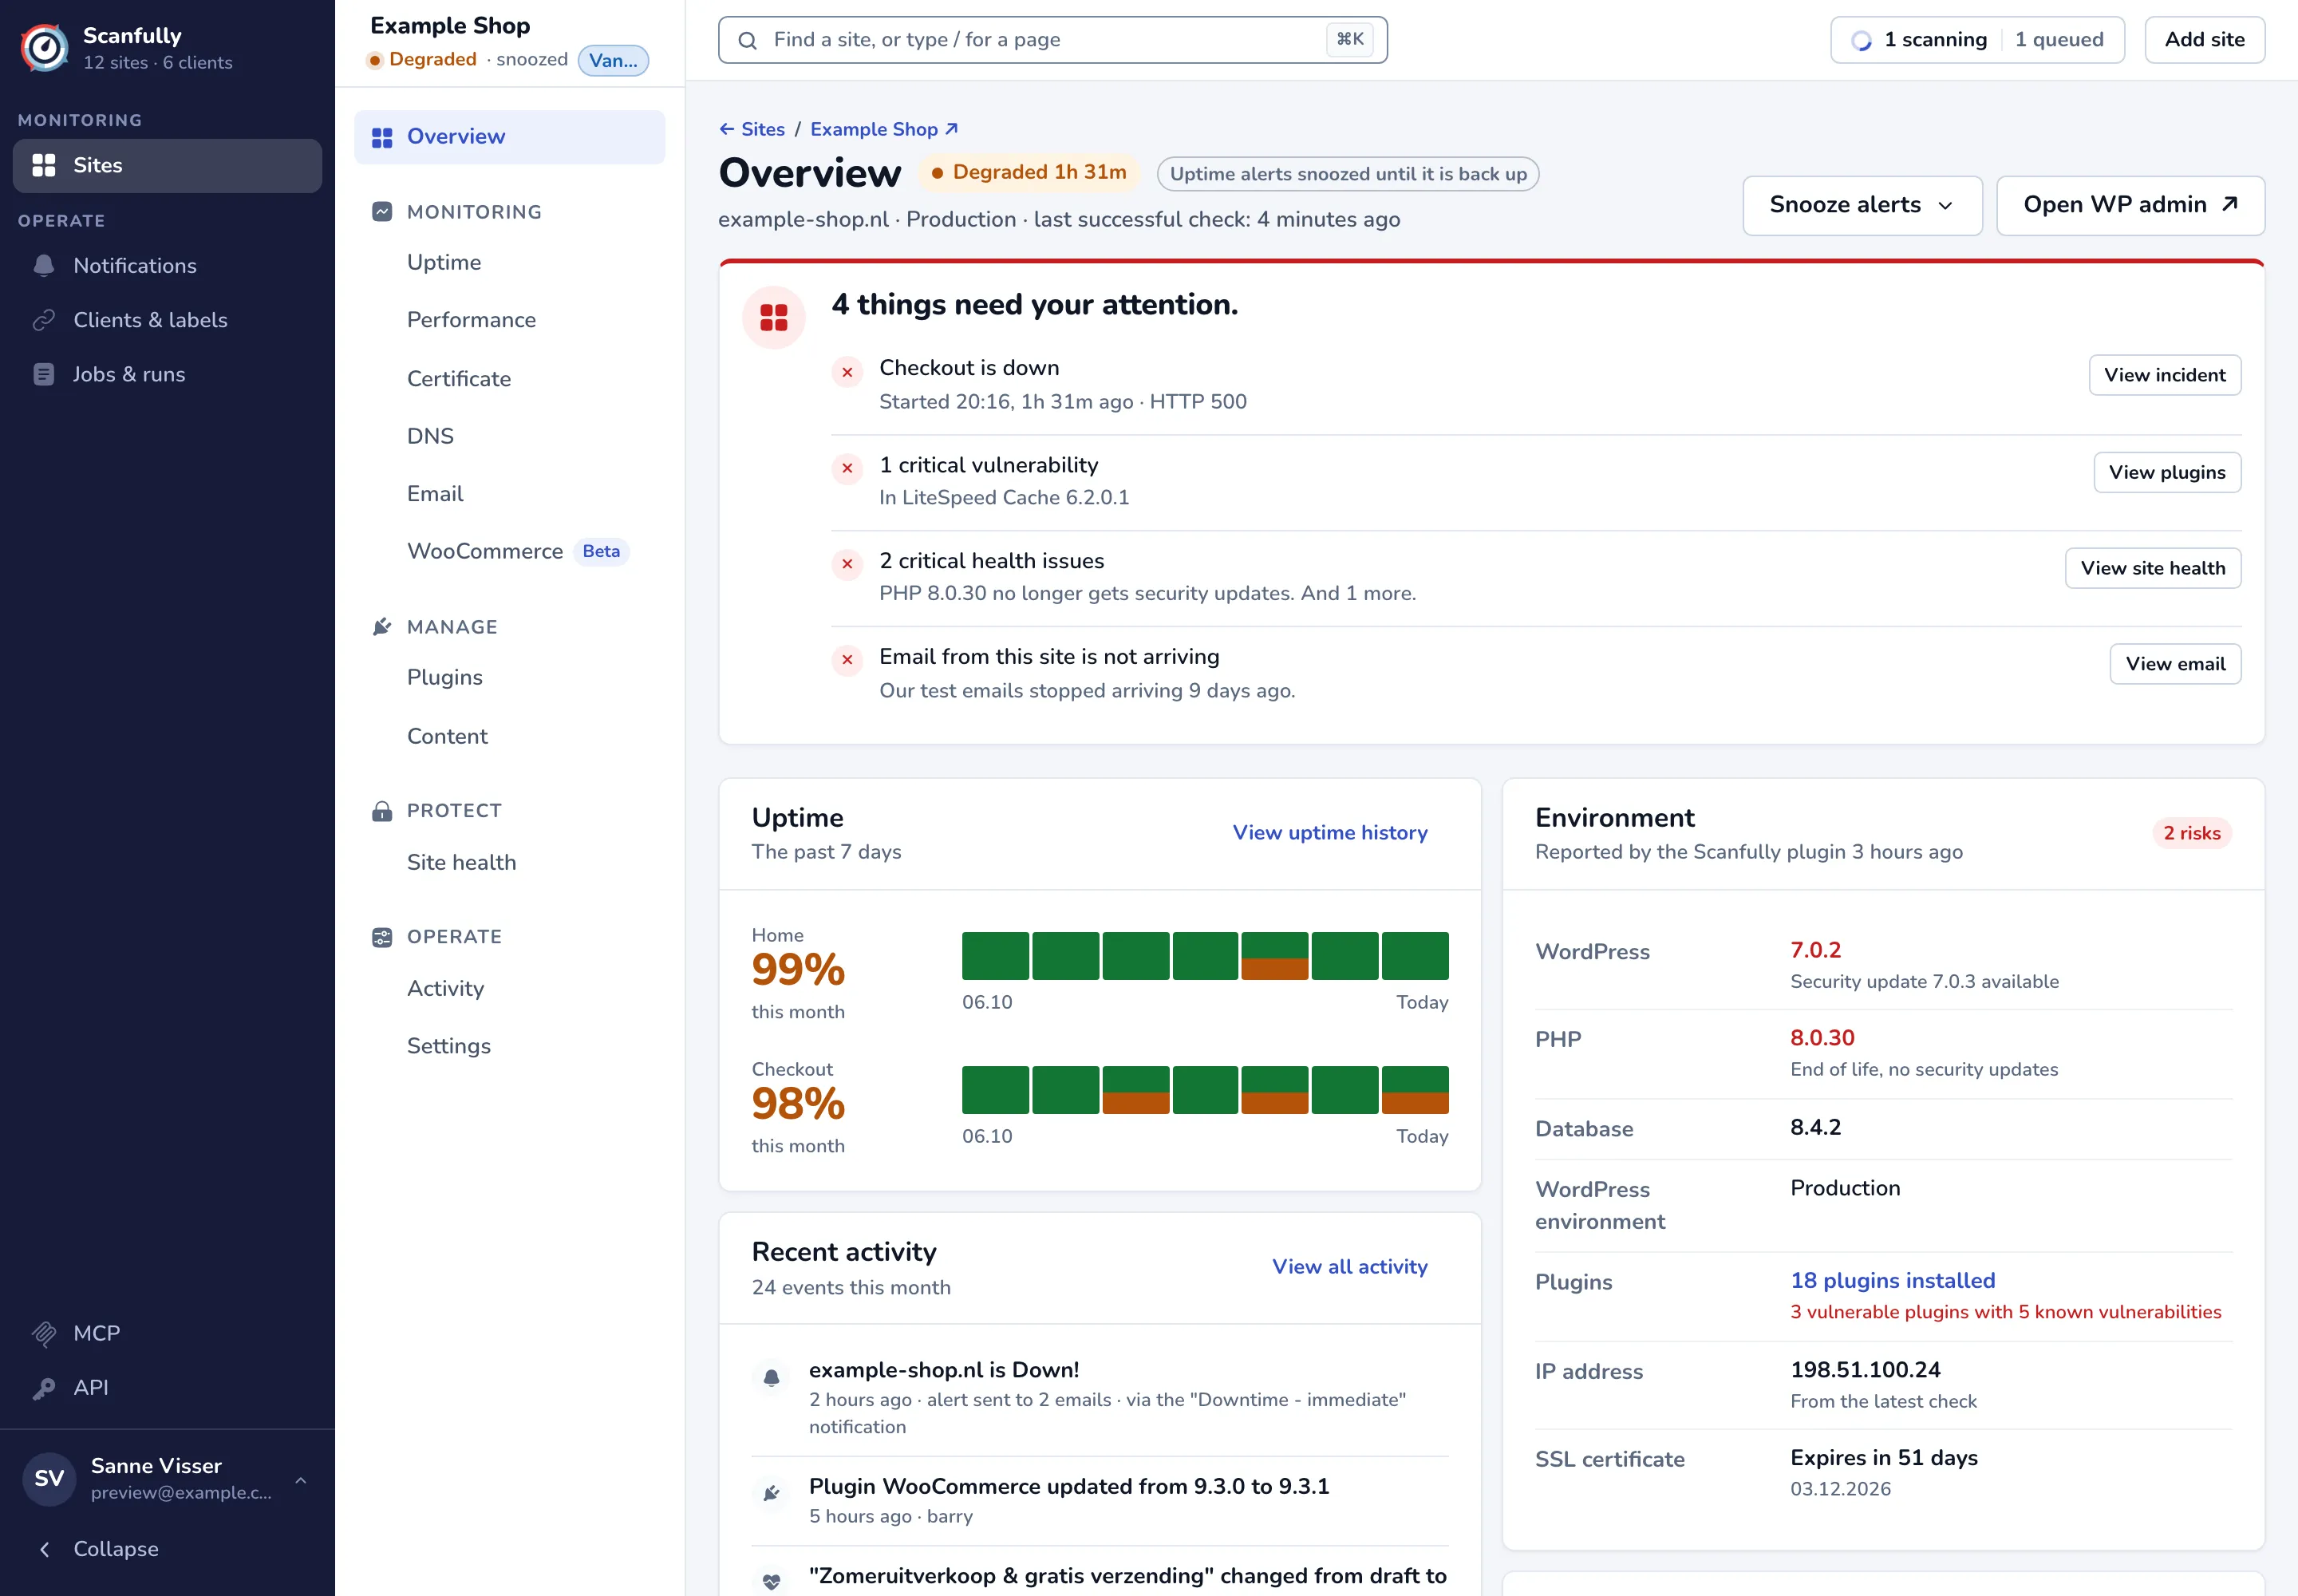
Section titled “The site menu”On a site’s screens, the column next to the main menu shows the site’s name, its status (for example Degraded, or Down with how long it has been down), whether its alerts are snoozed, and its client. Below that is the site menu:
- Overview
- Monitoring: Uptime, Performance, Certificate, DNS, Email and WooCommerce (beta)
- Manage: Plugins and Content
- Protect: Site health
- Operate: Activity and Settings
On a narrow screen the same sections are in a menu above the page.
The header
Section titled “The header”The header shows the site’s status, such as Healthy, Degraded 1h 31m or Down, and a note when alerts are snoozed. The line below it gives the domain, the WordPress environment and the time of the latest uptime check, for example “last successful check: 4 minutes ago”.
- Snooze alerts pauses the site’s alerts for a while. See Notifications.
- Open WP admin opens the site’s WordPress dashboard in a new tab.
- The site’s name in the breadcrumb opens the live site.
What needs your attention
Section titled “What needs your attention”The panel at the top lists what needs you, worst first. With one item it states the problem and gives its button; with several it says how many things need your attention and lists each with a button to the screen that resolves it:
| Item | Button |
|---|---|
| The site is down, or a single page such as Checkout is down, with when it started and the cause | View incident |
| Critical plugin vulnerabilities, with the plugins they are in | View plugins |
| Critical health issues, such as a PHP version that no longer gets security updates | View site health |
| The certificate has expired, or expires within 7 days | View certificate |
| Email from this site is not arriving | View email |
| Important DNS records changed | View DNS |
When nothing needs you, the panel says Everything is okay. If some of the data could not be loaded, it says so, because the list may then not be complete.
A banner below it warns when a firewall or the server blocks the Scanfully uptime monitor. See Scanfully IP addresses.
Uptime
Section titled “Uptime”The Uptime panel shows each monitored page with its uptime percentage this month and a bar for each of the past 7 days. View uptime history opens Uptime.
Recent activity
Section titled “Recent activity”Recent activity lists the latest events on the site, such as plugin and theme updates, WordPress updates, saved content and alerts that were sent, with the number of events this month. View all activity opens Activity.
Environment
Section titled “Environment”Environment shows what the site runs on, as reported by the Scanfully plugin:
- WordPress, PHP and Database versions, each with a note when there is a newer release, a security update, or the version no longer gets security updates.
- WordPress environment: Production, Staging, Development or Local.
- Plugins: how many are installed and how many have known vulnerabilities.
- IP address: the address the latest uptime check reached.
- SSL certificate: when it expires.
A pill at the top counts the risks it found, such as an outdated PHP version. Without the plugin, or before its first report, the panel says there is no Site Health report yet. Right after you connect a site, the first report takes a few minutes.
Response time
Section titled “Response time”Response time charts the load time of each check in the last 24 hours, split into its phases, with the average. View performance opens Performance.
A site without monitored pages
Section titled “A site without monitored pages”If a site has no pages to monitor, the overview shows No monitored pages with Add a page to monitor, which opens the site’s settings.