
Uptime
Scanfully requests every monitored page of your site every minute and records whether it answered the way it should. The Uptime screen brings this together for one site: its current status, the response time and availability of each page, the recent incidents, and how the monitor is set up.
To open it, choose a site and click Uptime under Monitoring in the site menu.
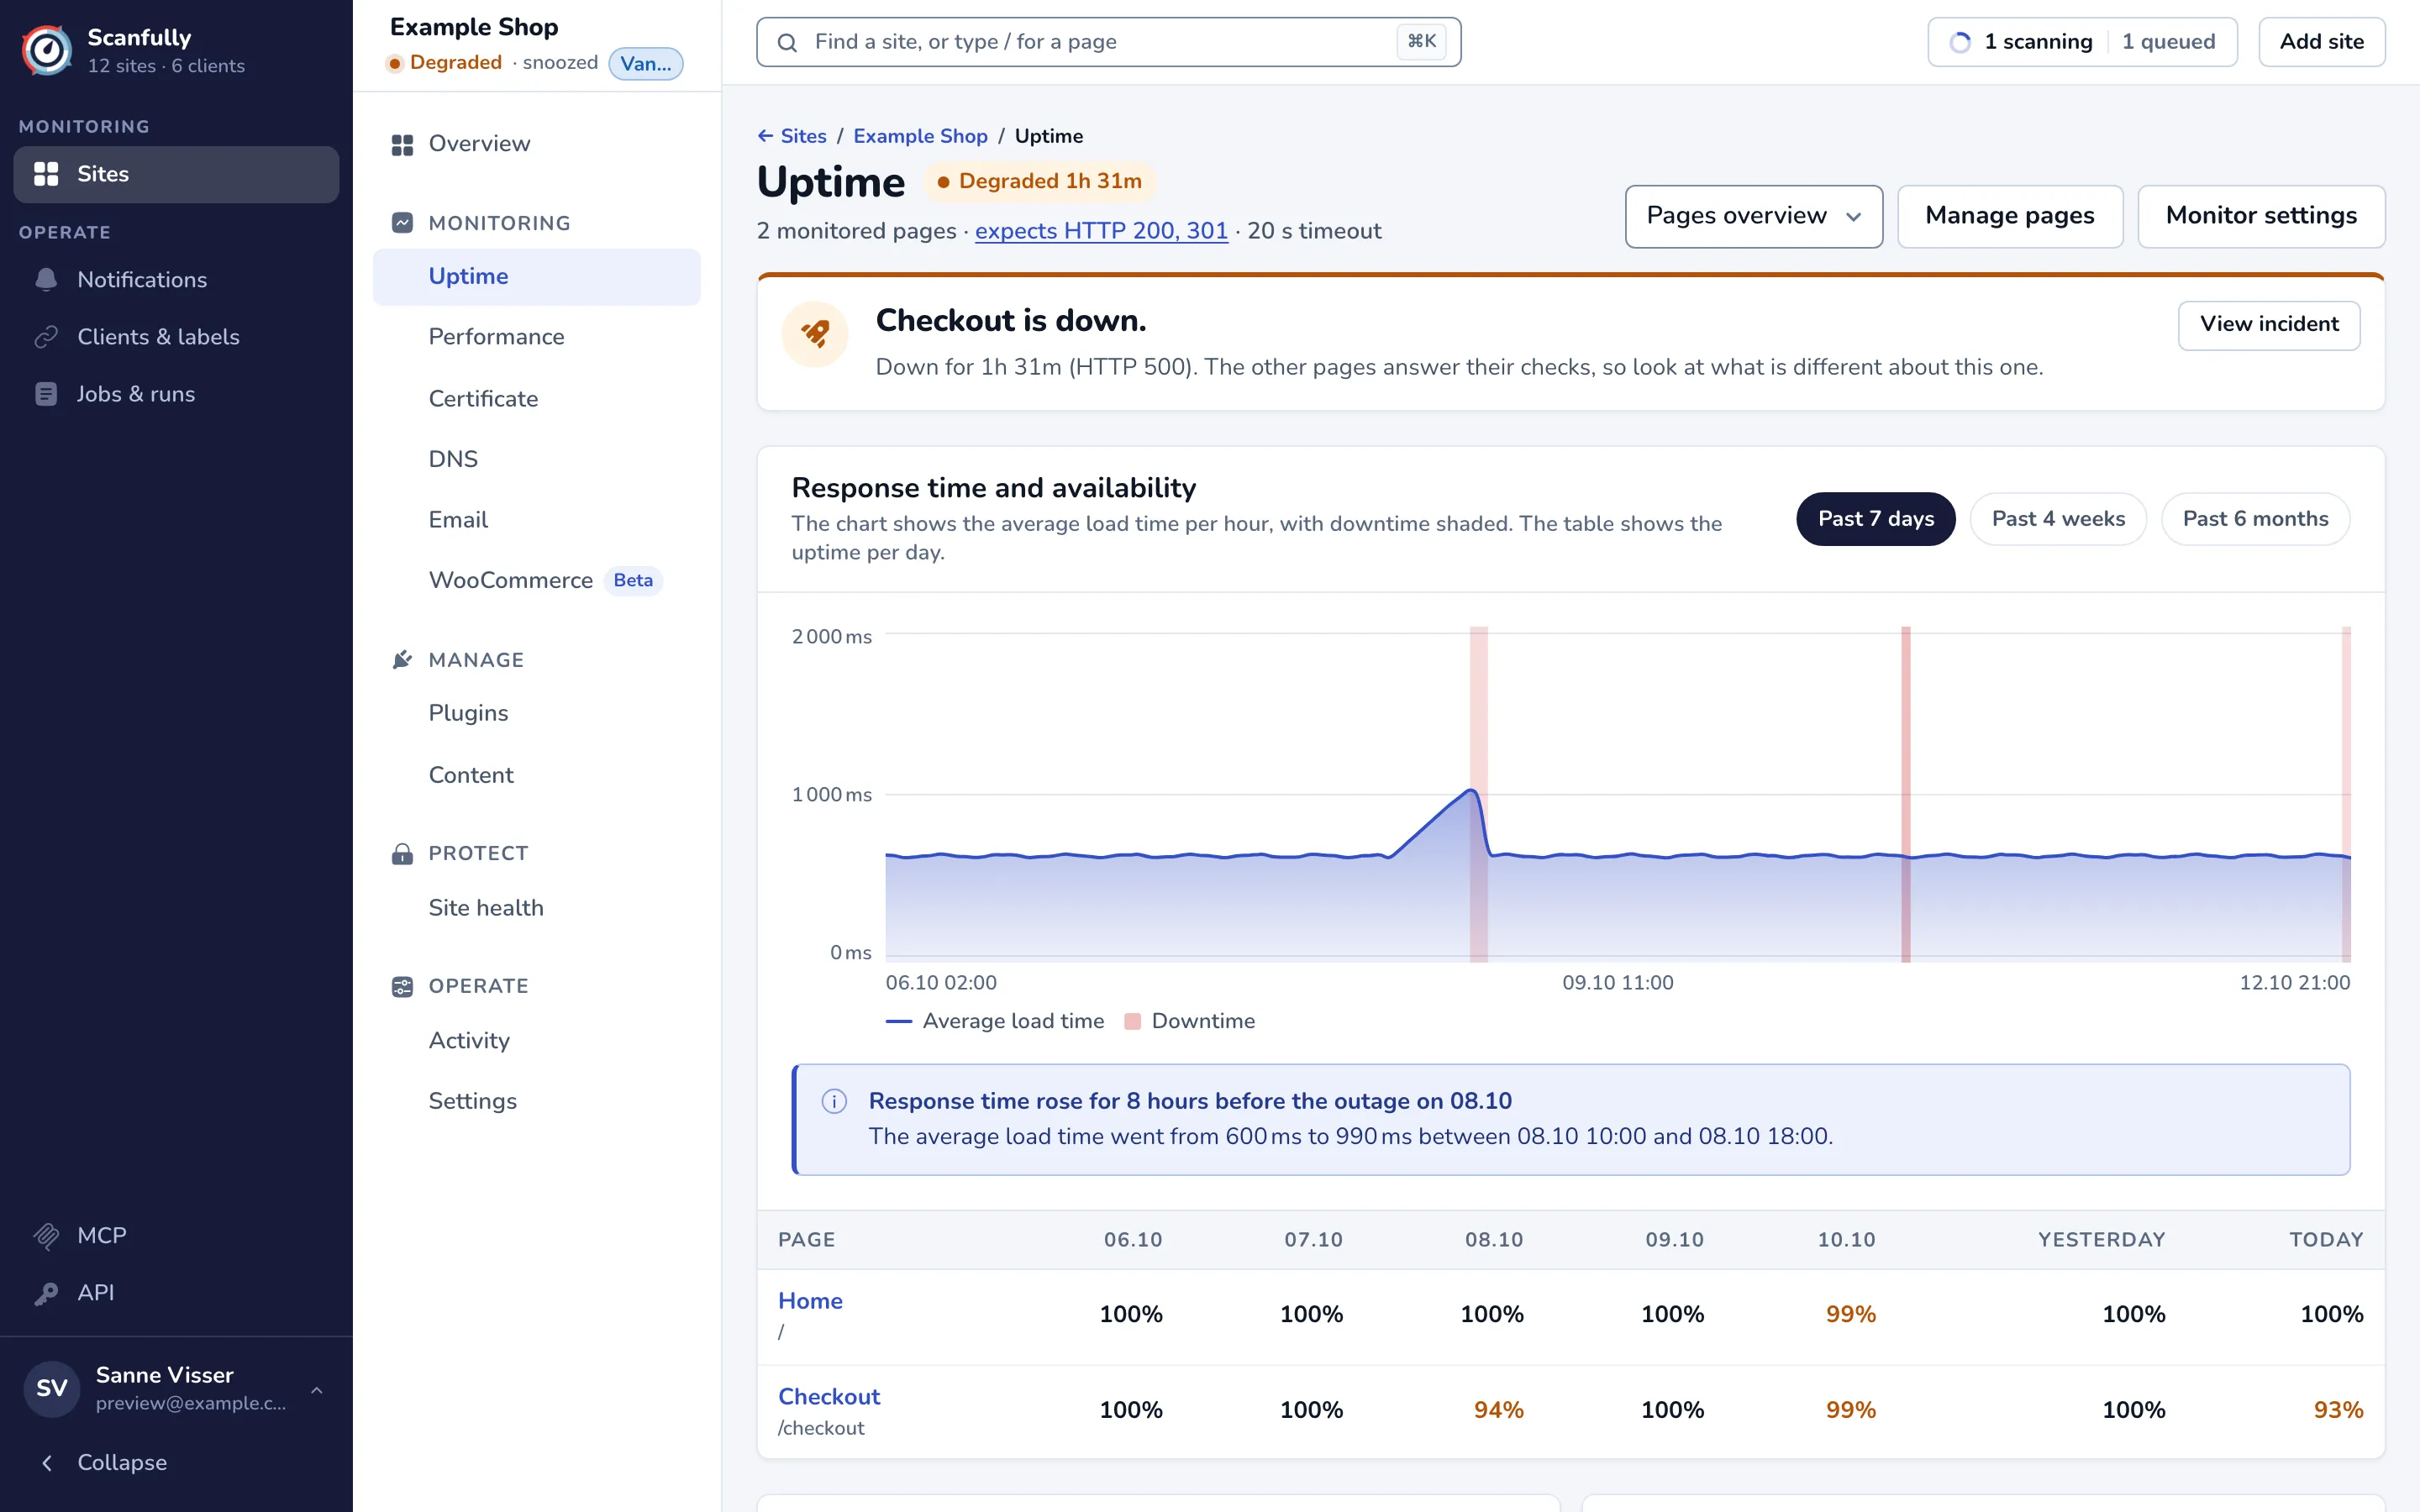
The header
Section titled “The header”Next to the title, a pill shows the status of the site:
- Healthy: every monitored page answers its checks.
- Degraded: one or more pages are down, but not all of them, or recent checks only got cached answers from a CDN. While a page is down, the pill says how long, for example Degraded 1h 31m.
- Down: every monitored page is failing its checks, with how long it has lasted.
- Monitor blocked: the server or a firewall refused the latest check (see When the monitor is blocked).
Under the title you see how many pages are monitored, which HTTP status codes the monitor expects and its timeout. The expected codes link to the monitor settings.
The buttons on the right:
- Pages overview opens a menu of the monitored pages. Pick one to open its page uptime screen.
- Manage pages opens the site settings, where you add, change or remove monitored pages. See Site settings.
- Monitor settings opens the monitor settings.
The headline
Section titled “The headline”The panel at the top tells you what needs attention first: the site is down, a page is down, a CDN may be hiding a problem, the monitor is blocked, or every page is up. When a page is down, View incident opens the downtime details of the longest open incident.
Response time and availability
Section titled “Response time and availability”This panel combines a chart and a table for the period you pick with Past 7 days, Past 4 weeks or Past 6 months.
- The chart shows the Average load time of the site, with Downtime shaded. For the past 7 days it plots one point per hour, for the longer periods one point per day.
- When the response time rose before an outage in the period, a note under the chart says by how much and between which times. A slow climb before an outage often points at the cause.
- The table has a row per monitored page and a column per day, calendar week or calendar month, with the uptime in whole percent. 100% is shown in black, anything lower in orange or red. Click a page name to open its page uptime.
Incidents
Section titled “Incidents”Incidents lists the downtimes of every monitored page, newest first, with when each one started and recovered, its duration, its cause (an HTTP status, Timed out or No response) and, on a site with more than one page, the page. The list holds the last 10 incidents per page.
Click a row, or View log, to open the downtime details.
Export CSV saves the incidents in the list as a CSV file, with the page, URL, start and recovery time (UTC), duration in seconds, cause, HTTP status and whether the check timed out.
Monitor
Section titled “Monitor”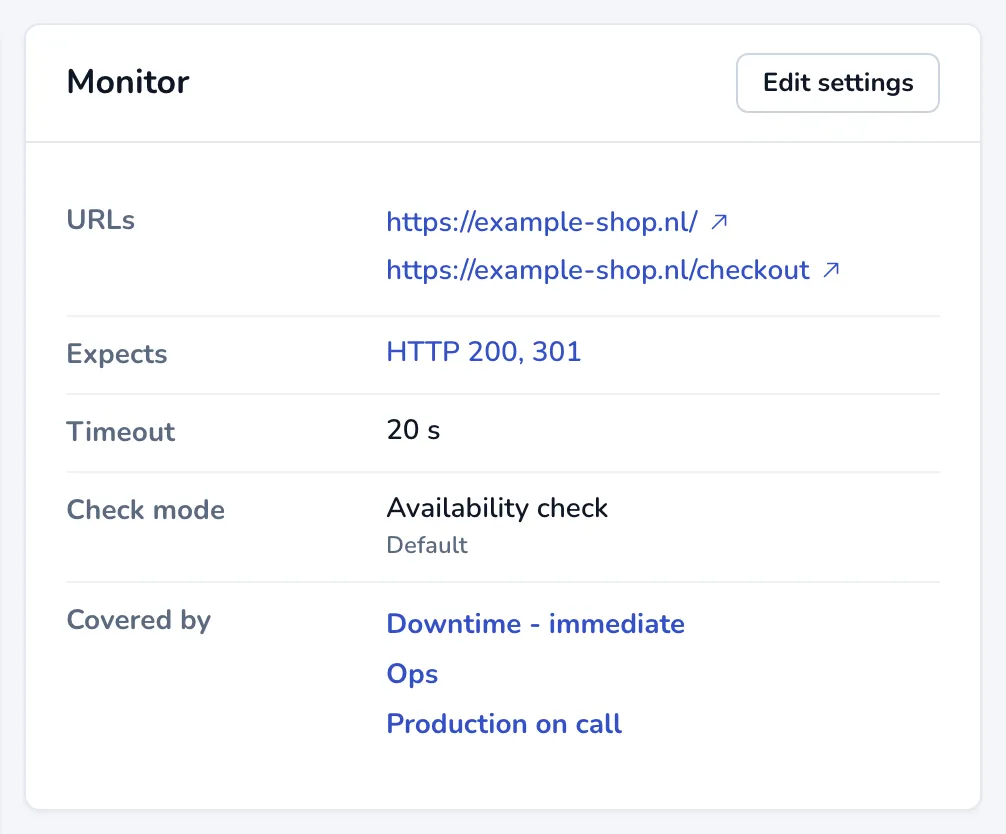
The Monitor panel shows how the site is checked:
- URLs: the address of each monitored page.
- Expects: the status codes that count as up. Any 2xx response is the default.
- Timeout: how long a check waits for an answer.
- Check mode: Availability check or Origin check.
- Covered by: the notifications that send an alert when the site goes down or comes back up. Click a name to open it. When no notification covers downtime, the panel says so. See Notifications.
Values you did not change are marked Default. Edit settings opens the monitor settings.
Certificate
Section titled “Certificate”The Certificate panel summarizes the TLS certificate of the site: when it expires, who issued it and which names it covers. It shows Action needed when the certificate has expired or does not cover the domain, and Action soon when it expires within seven days or does not cover the www (or non-www) form of the domain. View certificate opens the Certificate screen.
When the monitor is blocked
Section titled “When the monitor is blocked”Some hosting firewalls and rate limiters refuse the Scanfully monitor while real visitors get the page. Scanfully treats an answer of HTTP 401, 403, 406 or 429, or a Cloudflare challenge page, as blocked. A blocked check does not count as downtime and does not send down or recovery alerts, but while the block lasts Scanfully cannot confirm that the site is up.
The status pill then shows Monitor blocked and the headline explains which pages are affected. Scanfully has no fixed IP addresses to allow (see Scanfully IP addresses), so to fix it, add a custom request header and let your firewall, or your hosting provider, allow requests that carry it.
When a CDN hides a problem
Section titled “When a CDN hides a problem”With the default Availability check, the monitor sees what a visitor sees, including pages a CDN serves from its cache. When recent checks only got cached answers that were past their freshness window, the headline says A CDN may be hiding a problem.: the server behind the CDN may be down while the cache still answers. Check that the server is running. If you want the monitor to reach your server every time, switch to Origin check in the monitor settings.