
Downtime details
Every downtime of a monitored page has its own screen. It answers the questions you have during or after an outage: how long did it last, did anyone get an alert, what changed on the site around that time, and what exactly did the failed check get back?
To open it, click a row or View log in Incidents on the Uptime screen or in Downtime periods on the page uptime screen.
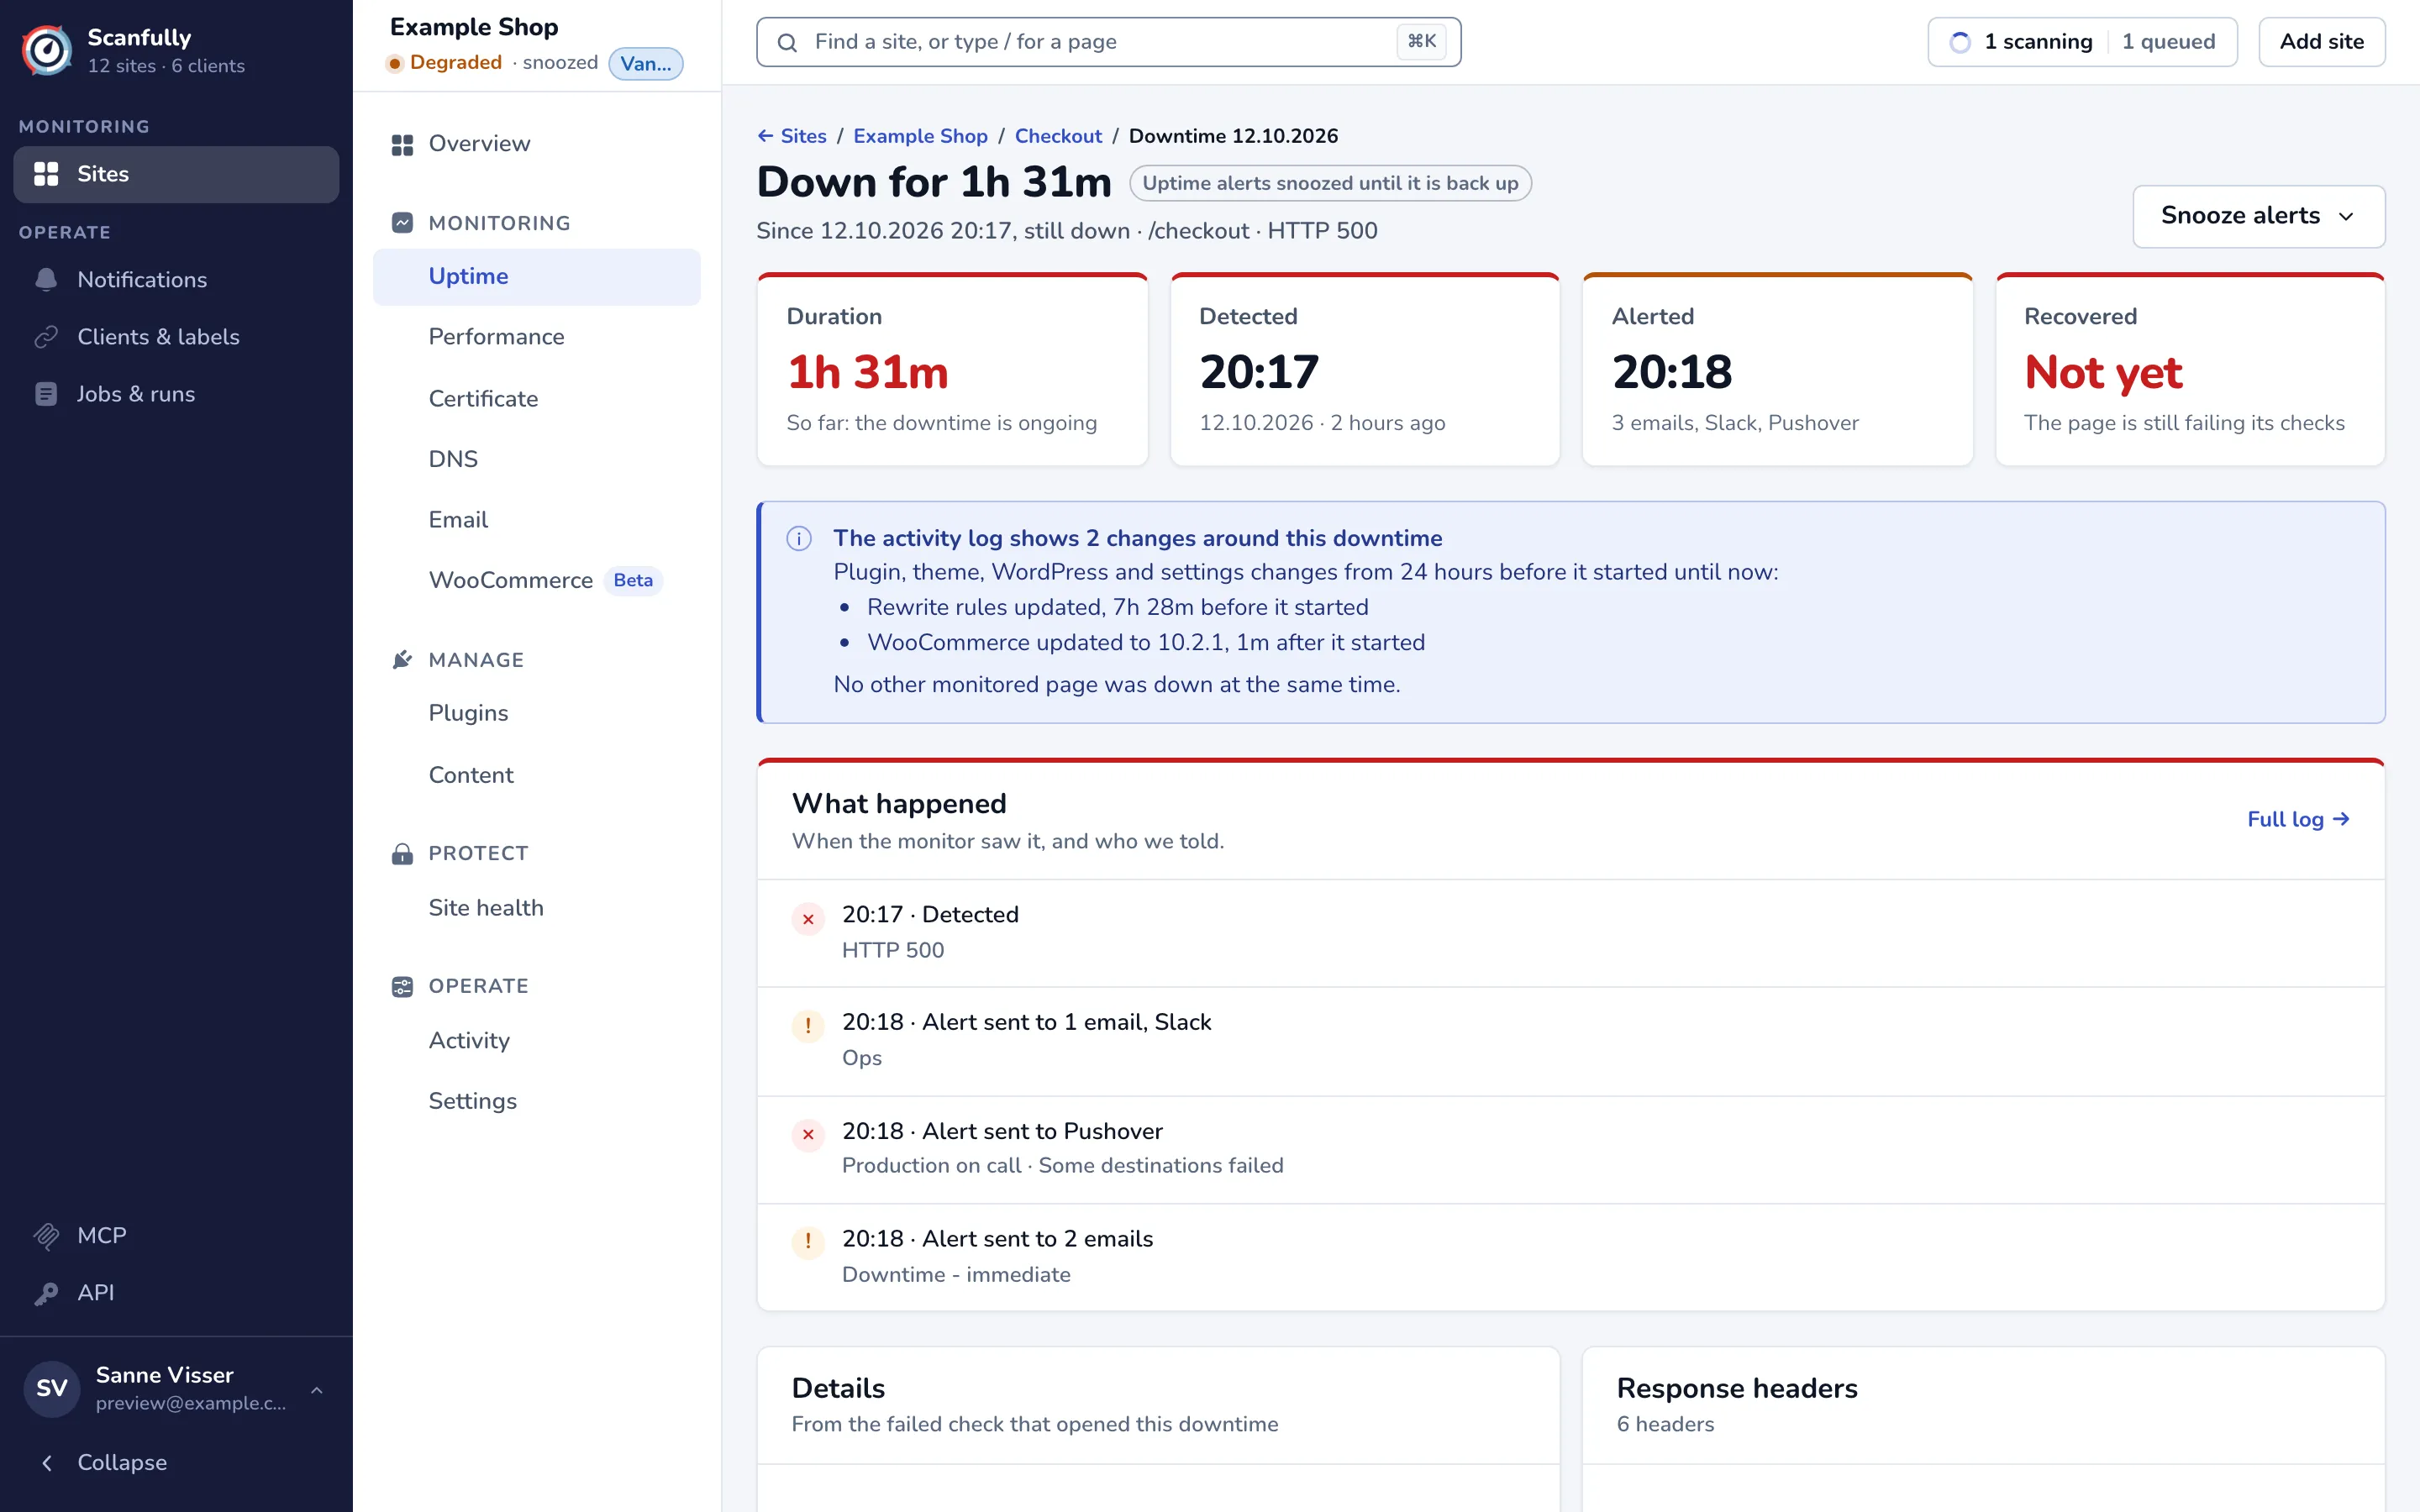
The title says how long the page was down, or has been down so far. Below it you see the start and end time, the page path and the cause: an HTTP status such as HTTP 500, Timed out, or No response.
The cards
Section titled “The cards”- Duration: how long the downtime lasted. While it goes on, the card says it is the time so far.
- Detected: when the monitor confirmed the failure and opened the downtime.
- Alerted: when the first alert went out and to which channels. If none went out, it says why, for example that the site was snoozed, that the page came back within the wait before alerting, or that no notification covers downtime on this site.
- Recovered: when the page answered its checks again, or Not yet while it is still failing.
What changed around it
Section titled “What changed around it”When Scanfully can tell, a note under the cards lists the plugin, theme, WordPress and settings changes the activity log recorded from 24 hours before the downtime until it ended (or until now), each with how long before or after the start it happened. It also says whether other monitored pages were down at the same time. An update just before an outage is often the first thing to check. The activity log needs the Scanfully plugin; see Activity.
What happened
Section titled “What happened”What happened is the timeline of the downtime: when it was detected, every alert about it (sent, snoozed or held back, per notification), any still-down message after a snooze ended, the recovery and the recovery messages. Full log opens the notification log for the same time. See Notifications.
Details and response headers
Section titled “Details and response headers”Details lists the facts of the failed check that opened the downtime: Detected at, Recovered at, Duration, Cause, HTTP status, Timeout, Target URL, Target IP and the Downtime ID.
Response headers shows the headers of the failed answer, if there were any. Headers such as Server or a CDN’s own headers tell you which part of the chain answered.
Snooze alerts during a downtime
Section titled “Snooze alerts during a downtime”While a downtime is still going on, Snooze alerts at the top right stops uptime alerts for the site until it is back up. Checks keep running and everything is still recorded. Once a snooze runs, the title shows it, for example Uptime alerts snoozed until it is back up, and the same button lets you change the snooze or resume alerts.