
Page uptime
Each monitored page has its own uptime screen. Use it to tell an outage of one page from an outage of the whole site, and to see exactly what the monitor got on its latest request.
To open it, click a page name in the table on the Uptime screen, or pick the page from the Pages overview menu at the top.
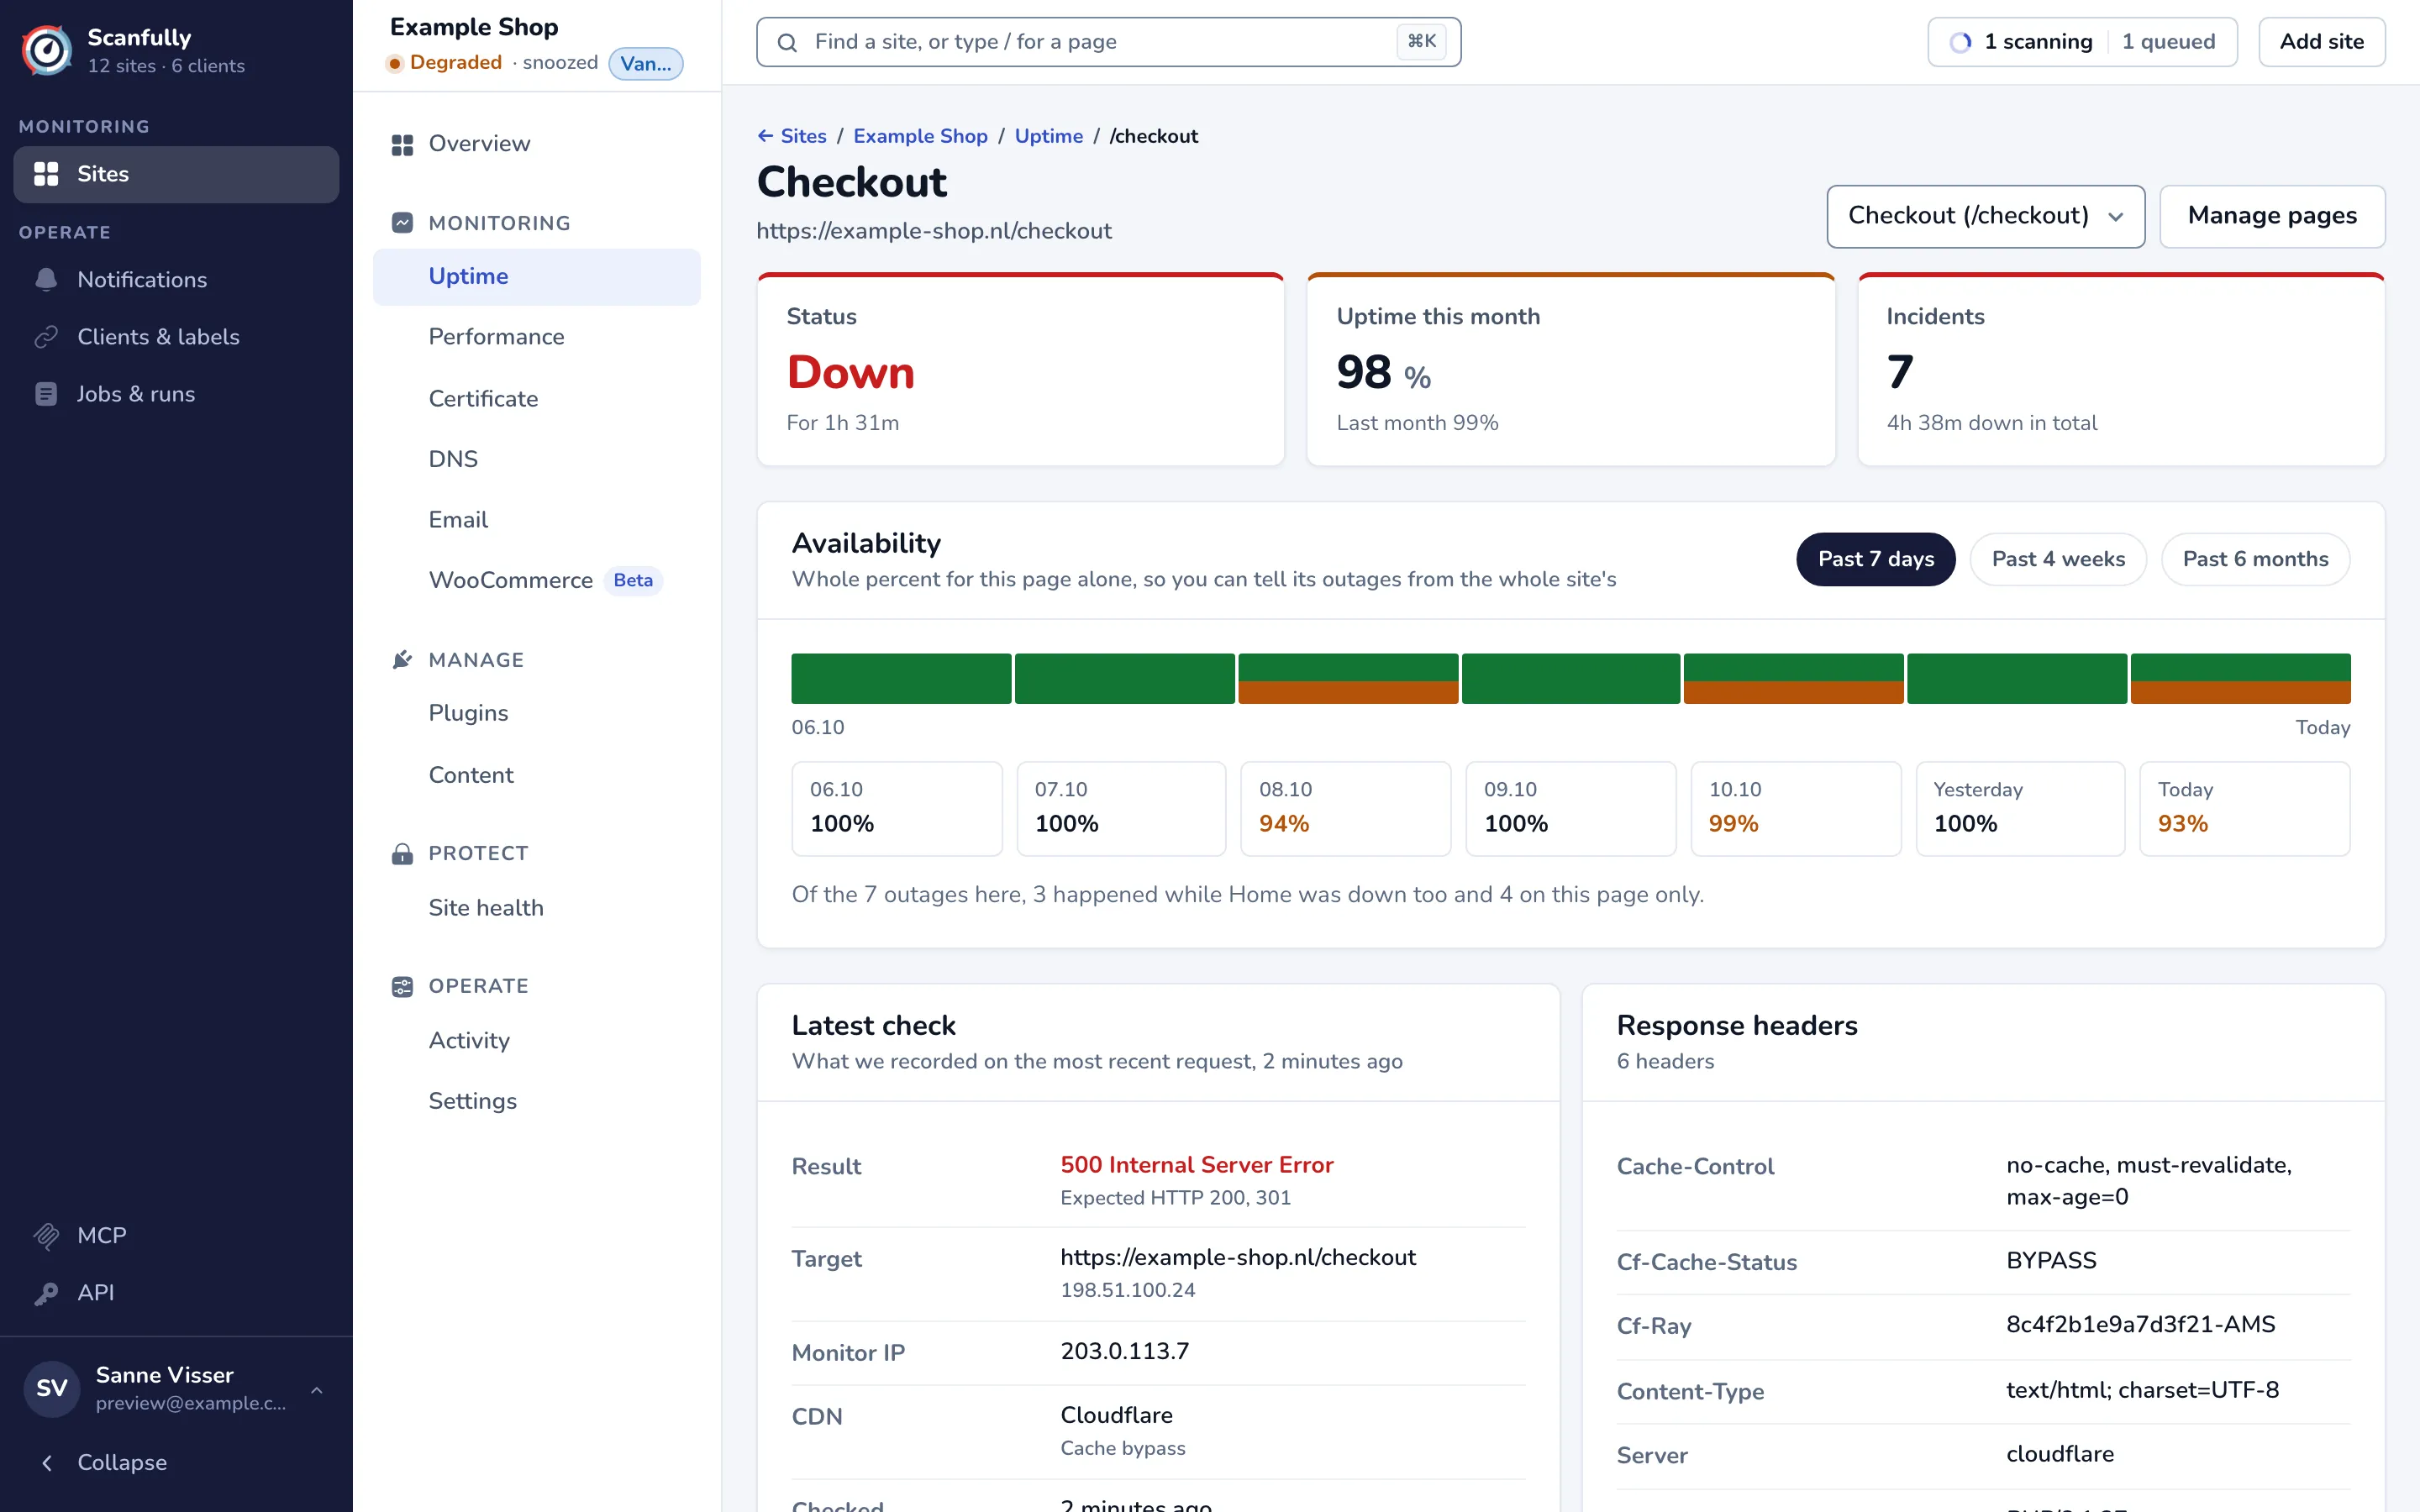
The header shows the page name and its full address. The menu next to it switches to another monitored page or back to Pages overview; Manage pages opens the site settings.
Status, uptime and incidents
Section titled “Status, uptime and incidents”The three cards at the top:
- Status: Down with how long, Healthy with the time of the last check, Degraded when the last check failed but the page is not marked down yet, or Monitor blocked when the server or a firewall refused the check. Blocked checks don’t count as downtime. A new page shows Waiting for the first check.
- Uptime this month: the uptime of this page in the current month, with last month’s figure below it.
- Incidents: the number of downtimes on record and how long the page was down in total. Scanfully keeps the last 10 per page here.
Availability
Section titled “Availability”Availability shows the uptime of this page alone, in whole percent, for the Past 7 days, Past 4 weeks or Past 6 months. The bar colours each day, week or month: green at 100%, orange when there was some downtime, red when the page was down the whole time. The tiles below list each figure.
On a site with more than one monitored page, a sentence below compares the outages of this page with the other pages, for example how many happened while another page was down too. When every page goes down together, look at the server; when only this page goes down, look at what is different about it.
Latest check
Section titled “Latest check”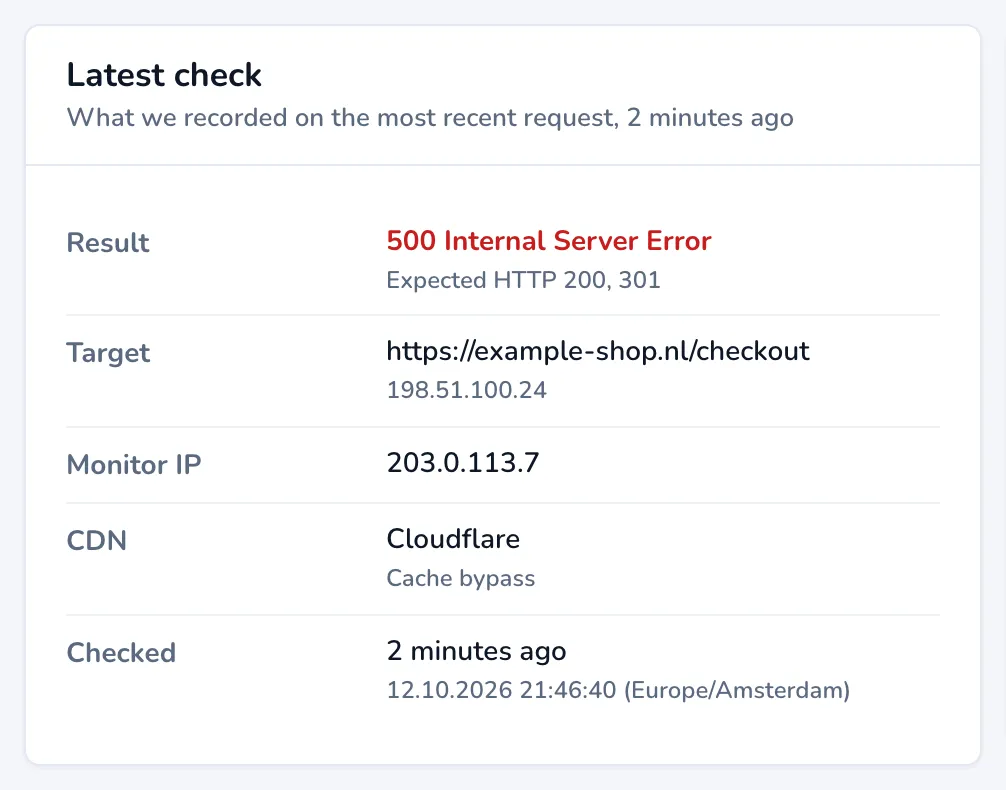
Latest check shows what the monitor recorded on its most recent request:
- Result: the status the page answered with, against the codes the monitor expects. A Monitor blocked label means the server or a firewall refused the check; Cached only means the answer came from a CDN cache past its freshness window, so your server may not have been reached.
- Target: the address that was requested and the IP address it resolved to.
- CDN and Cache age: shown when the answer came through a CDN, with its cache status and age.
- Checked: when the check ran.
Response headers lists every header of that answer.
Downtime periods
Section titled “Downtime periods”Downtime periods lists the last 10 downtimes of this page, newest first, with when each started, how long it lasted, when it recovered and its cause. View log opens the downtime details.